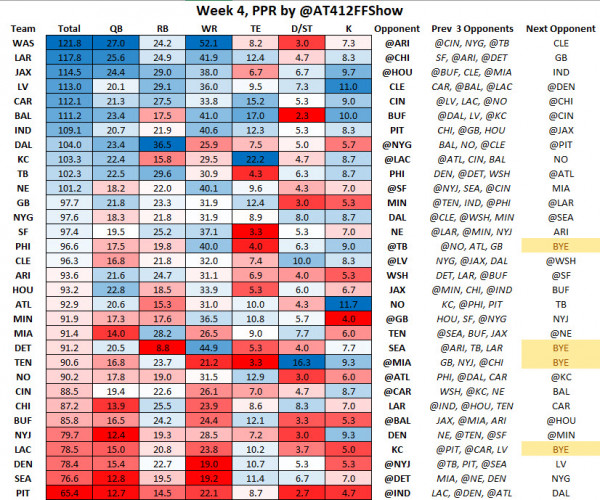
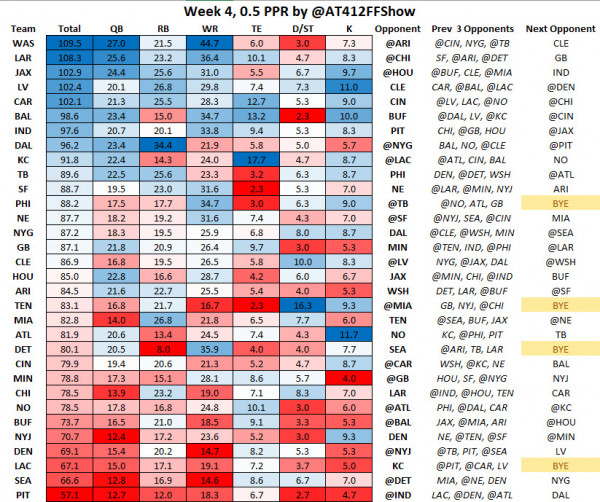
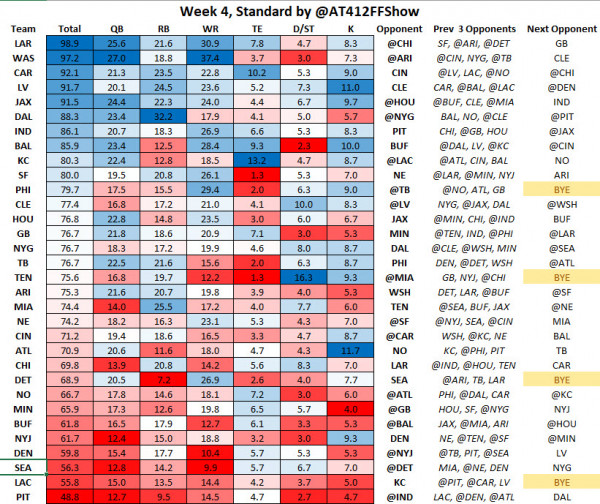
Because things change so drastically on a week to week basis in the NFL, I wanted to see how the matchups looked using a three week window. As the season goes on, this will be a great matchup tool as you can see how teams are trending beyond just seasonal averages.
How to read the chart: This data is showing the amount of points allowed, so if you’re looking at QBs, the Washington Commanders are allowing a lot of PPG in the last 3 weeks (good matchup for Kyler Murray) while the Pittsburgh Steelers are not (bad matchup for Anthony Richardson).
- Blue = good matchup, White = average matchup, Red = bad matchup.
- The team in the Opponent column is who plays the team on the left this week.
- The teams in the Prev 3 Opponents column are the teams that the team on the left has played in the last 3 weeks.
- The team in the Opponent column is who plays the team on the left this week.
- The team in the Next Opponent column is who plays the team on the left next week.
- Teams with a bye in the last 3 weeks will look back a 4th week to capture 3 games worth of data.
Please keep in mind that D/ST Data will likely be different due to varied league settings.
Comments


Hell yeah, Joe!
Love this!
Awesome post love the data and it’s easy to read lol